Image: Gulfstream Aircraft.
Between 2023 and 2025, UAE-origin premium (First and Business class) seats to the Southwest Pacific rose from 282,152 to 361,594, a 13.2% Compound Annual Growth Rate (CAGR), second only to Northeast Asia (15.6%) among eight global regions (OAG). Yet Dubai-Auckland, the corridor with arguably the strongest emerging wealth signal, did not add a single premium seat, while OAG’s 2026 forward schedule shows regional premium capacity down 25.3%. For charter operators and financiers weighing where to deploy long-range business aviation capital, the question is no longer whether the region is growing, but how to read signals that point in opposite directions.
This analysis applies the author’s corridor scoring and capital allocation framework (Airline Premium Seat Capacity as a Demand Proxy, International Aviation Management Conference 2026, Emirates Aviation University, 17 November 2026) to eight UAE-origin corridors. It draws on OAG scheduled First and Business seat data for 2023–2025 and the 2026 forward schedule, then closes the loop from corridor to aircraft: which market to prioritize, and which airframe serves it.
Premium Seats as a Business Aviation Signal
Premium cabins and private jets serve the same traveler. Sustained First and Business capacity reveals a structural willingness to pay for time, flexibility and privacy, the attributes that drive business aviation demand. The signal is strongest where travel is time-sensitive, frequent and relationship-driven, and weakest where demand is leisure-led or shaped by network strategy (Morrell, 2013). Premium seat capacity ranks among the most reliable leading indicators of European private jet activity (Ehmer et al., 2008), and 0.8-2.0% of premium airline volume converts to charter on mature long-haul corridors (Wensveen and Leick, 2009), consistent with the 0.99-1.32% observed on the UAE-UK corridor (Airline Premium Seat Capacity as a Demand Proxy study). Premium capacity is therefore one data point, not a verdict: read over several years and alongside wealth, trade and mission data, it helps sort corridors into those to commit to, build or monitor.
Eight Corridors, Three Postures
The Southwest Pacific accounts for only 5.0% of total UAE outbound premium capacity, but that capacity is highly concentrated. Dubai-Sydney and Dubai-Melbourne carry 49% of the region’s 2025 premium seats; adding Dubai-Brisbane and Dubai-Perth lifts the share to 80%. The read is three capital postures, each matched to a different kind of evidence, as shown in Chart 1.
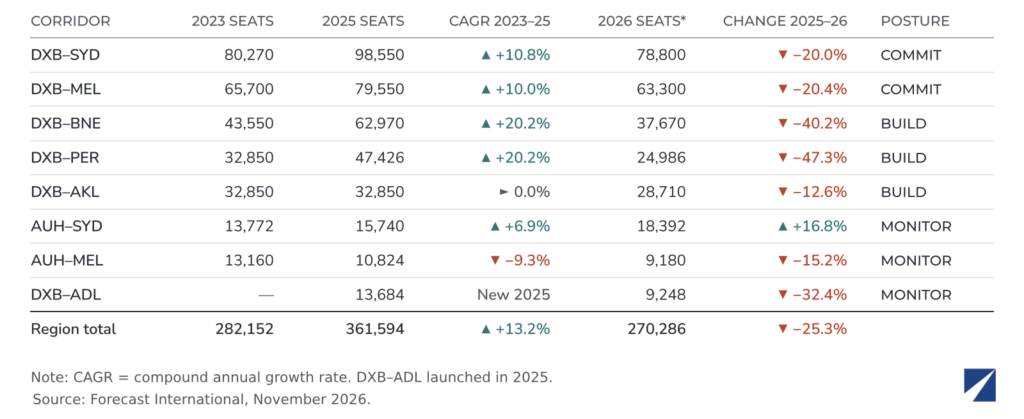
Chart 1. Southwest Pacific Corridors, UAE-Origin Premium (F&B) Seats, 2023–2026. *Forward schedule pulled Sept 2026; Sept-Dec provisional. Source: OAG, Forecast International.
Commit (Tier 1, proven demand density). Dubai-Sydney and Dubai-Melbourne sustain double-digit growth, 10.8% and 10.0% a year, on the region’s largest base. These are the anchor corridors for direct client relationships and dedicated basing.
Build (Tier 2, early inflection). Dubai-Brisbane and Dubai-Perth compounded at 20.2% a year, the region’s fastest. They suit opportunistic capacity and channel-partner deployment before competitive density consolidates. Dubai-Auckland sits in the same volume tier at 0.0%, a corridor that needs a different lens.
Monitor (Tier 3, nascent). Abu Dhabi-Sydney is steady but thin at 6.9%; Abu Dhabi-Melbourne’s 9.3% decline warrants scrutiny of demand quality; and Dubai-Adelaide, new in 2025 with 13,684 seats, is a genuine first-mover window worth tracking for acceleration.
Tiering, rather than ranking, is the point: a ranked list would place Auckland fifth and move on, while a tiered read asks a different question of each corridor, as illustrated in Chart 2.
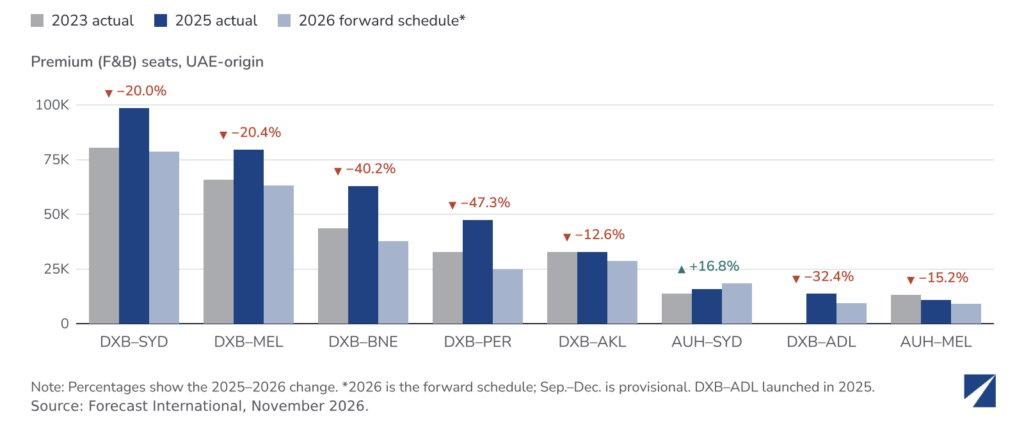
Chart 2. UAE-Origin Premium (F&B) Seats by Southwest Pacific Corridor, 2023, 2025 and 2026 (forward schedule, Sept-Dec provisional). Source: OAG, Forecast International.
Reading a Flat Corridor: Auckland and the Geneva Parallel
Flat scheduled premium capacity is not flat demand. Dubai-Geneva, one of the world’s most established business aviation markets, shows only a 2.6% CAGR in scheduled premium seats, because Geneva’s high-value demand moves predominantly through private aviation rather than airline cabins.
New Zealand offers a comparable setup with an identifiable catalyst. From 1 April 2025, the Active Investor Plus visa replaced its weighted NZ$15 million threshold with a Growth category at NZ$5 million over three years and a Balanced category at NZ$10 million over five. By mid-2026, it had drawn about NZ$4.5 billion in committed investment (Immigration New Zealand, 2025, 2026, Stanton & Partners Aviation).
Wealth-driven inflow of this kind is a leading indicator; scheduled capacity is a lagging one. Auckland’s flat line reads less like saturation than like a gap that corridor-level, tiered analysis is built to surface ahead of consensus. Notably, Dubai-Auckland also shows the smallest 2026 decline of any Dubai corridor in the region (−12.6%), even as the US-Iran conflict that began on 28 February 2026 forced capacity cuts across the UAE network. The cut was supply-led, but Auckland was cut least.
2026: Genuine Pullback or Unloaded Schedule?
OAG’s January-December 2026 UAE schedule shows Southwest Pacific premium capacity at 270,286 seats, 25.3% below 2025. Only January to August reflects near-final schedules; September to December remains forward schedule and can still change (OAG, 2026). The 2026 file also absorbs a supply shock. The US-Iran conflict that began on 28 February 2026 closed Gulf airspace and briefly halted Emirates’ Dubai operations. By late April, Emirates had recovered to about 80% of pre-war capacity and Etihad to about 75% (The National, 2026). Part of the 2026 decline is therefore supply withdrawn, not demand lost.
The pattern is uneven. Tier 1 corridors are down about 20%, while Tier 2 falls harder: Brisbane −40.2% and Perth −47.3%. Abu Dhabi-Sydney is the only corridor growing (+16.8%), consistent with Abu Dhabi’s outsized airport-level growth between 2023 and 2025. The pullbacks look more like conflict-related supply cuts and later-2026 schedules not yet fully loaded than a structural reversal, but schedule data alone cannot confirm it. Capital posture should hold until Q4 load-factor and frequency data arrive; re-tiering on a partial file would repeat the single-year-snapshot error the framework exists to avoid.
Matching the Aircraft to the Mission
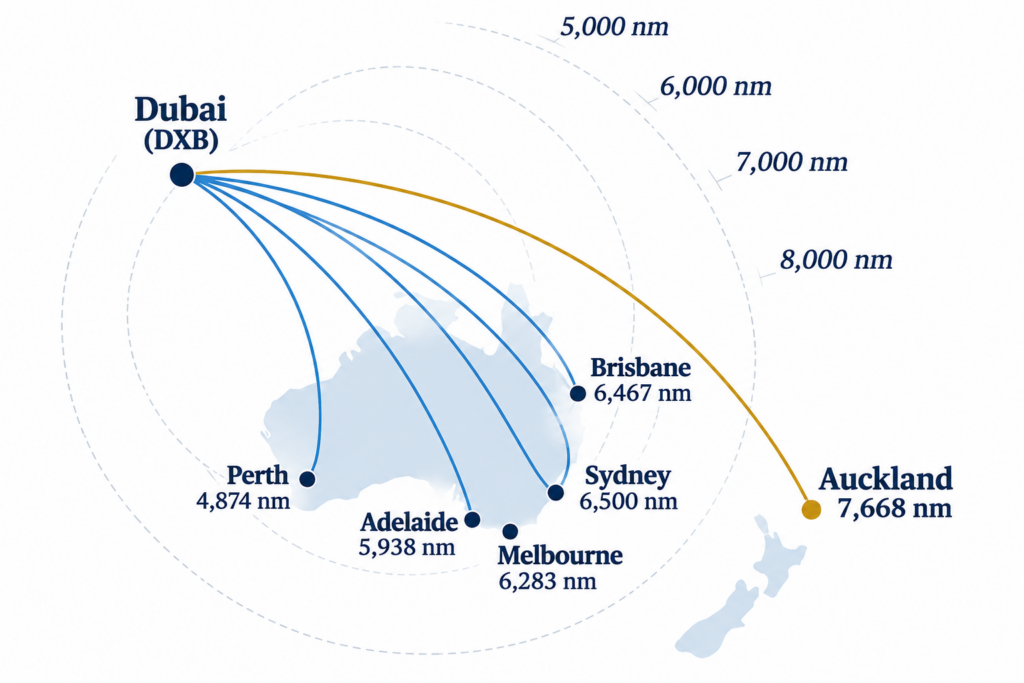
Corridor scoring identifies where to deploy; mission profile determines what to deploy. Across the advisory mission set, missions from Dubai sit almost entirely above the 4,000 to 5,300 nm band of the large-cabin segment. Great-circle distances run from 4,874 nm to Perth and 5,938 nm to Adelaide, through 6,283 nm to Melbourne, 6,467 nm to Brisbane and 6,500 nm to Sydney, to 7,668 nm to Auckland, the outlier (Great Circle Mapper, 2026). None of the large-cabin platforms, including the Falcon 900LX, Falcon 2000LXS, Challenger 650, G400 and G500, clears this band. The relevant set sits one class up, as shown in Chart 3. Airliner-derived VIP jets are the other route to range: the BBJ MAX 7 (6,810 nm) clears every Australian corridor but not Auckland, while the ACJTwoTwenty (5,724 nm) reaches only Perth.
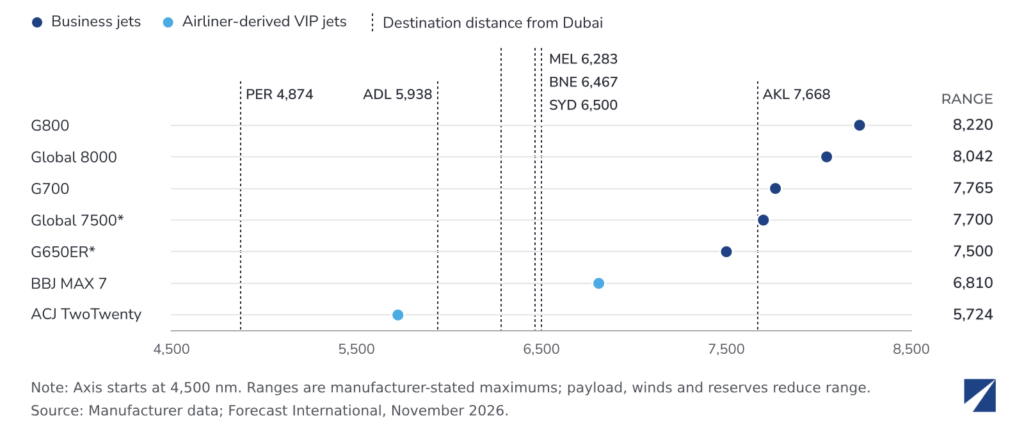
Chart 3. Great-Circle Distance from Dubai vs. Aircraft Range (nm). Axis starts at 4,500 nm. Range: BCA Purchase Planning Handbook Q1 2026, NBAA IFR, eight passengers (ACJ TwoTwenty: four passengers). * Out of production G650ER and Global 7500: range per AMSTAT. Sources: Great Circle Mapper, BCA; AMSTAT, Forecast International.
Auckland is the stress case. On the BCA basis, range leaves 97 nm of margin on the G700 (7,765 nm); on AMSTAT figures, the out-of-production Global 7500 (7,700 nm) leaves 32 nm, while the G650ER (7,500 nm) falls 168 nm short. These figures assume eight passengers in standard conditions; routings, winds, payload and reserves erode them. A fuel stop should be planned unless the mission justifies G800 (8,220 nm) or Global 8000 (8,042 nm) range.
Timing narrows the choice further. Gulfstream and Bombardier backlogs exceed a combined USD 46 billion (Gulfstream $24.0 billion, Bombardier $21.8 billion at end-Q2 2026), with orders outpacing deliveries roughly three-for-two (Forecast International, 2026). For a buyer whose timeline is set by a relocation rather than a delivery slot years out, that points to the pre-owned market. The G650ER’s decade-plus production run gives it by far the deepest pre-owned pool in the ultra-long-range class, while G700 and Global 7500 supply remains thin against their own backlogs. On that basis, the G650ER, G700 and Global 7500 form the natural shortlist for Sydney, Melbourne, Brisbane, Perth and Adelaide.
Which Aircraft Adds the Most Value
Range per dollar sharpens the shortlist. On BCA equipped prices and NBAA IFR ranges, five in-production business jets reach Sydney, the longest Tier 1 mission, and only three of them reach Auckland; two airliner-derived VIP jets are added for comparison, as shown in Chart 4. Which aircraft adds the most value depends on whether Auckland is in the mission set.
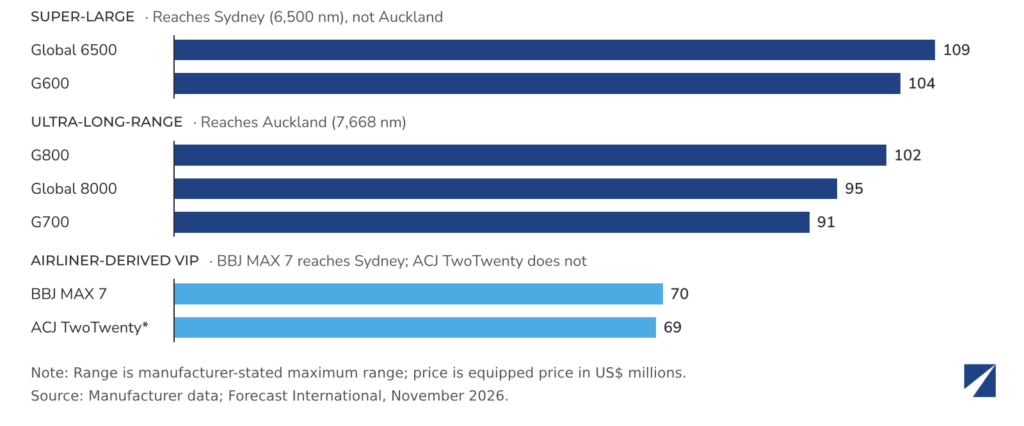
Chart 4. Range per US$ Million of Equipped Price, In-Production Aircraft Reaching Sydney, with Airliner-Derived VIP Jets for Comparison. Source: BCA Purchase Planning Handbook Q1 2026. NBAA IFR range, eight passengers (ACJTwoTwenty: four passengers, the only basis BCA publishes), Forecast International. Numbers are rounded.
Without Auckland, the Global 6500 adds the most value. At US$61.0 million and 6,636 nm, it delivers 109 nm per million dollars, the best of any aircraft that reaches Sydney, and costs US$19.4 million less than the G800. Its limit is margin, not reach: 136 nm to Sydney, 169 nm to Brisbane and 353 nm to Melbourne, before winds and reserves. That makes it a strong Tier 1 and Tier 2 aircraft, with Sydney nonstops that are weather-dependent. The G600 offers the same reach for US$2.5 million more.
With Auckland, the G800 adds the most value. It is the longest-range (8,220 nm) and least expensive (US$80.4 million) of the three flagships, scores 102 nm per million dollars, and is the only in-production aircraft with more than 500 nm of margin to Auckland on the BCA basis (552 nm). The Global 8000 (374 nm of margin, US$85.0 million) adds the segment’s highest cruise speed, Mach 0.95, which saves time on the region’s longest sectors. The G700 (97 nm of margin, 91 nm per million) buys a cabin 10 ft longer than the G800’s, not reach; on this route set it is the weakest value.
The same logic applies pre-owned: the G650ER covers every Australian mission with around 1,000 nm of margin but not Auckland, making it the pre-owned counterpart to the Global 6500, while the Global 7500 fills the Auckland role at a thin 32 nm.
Airliner-derived VIP jets buy cabin, not range per dollar. The BBJ MAX 7 (US$97.5 million, 6,810 nm) and ACJTwoTwenty (US$82.5 million, 5,724 nm) both deliver about 70 nm per million dollars, roughly 36% less than the Global 6500. The BBJ MAX 7 reaches Sydney with 310 nm of margin, more than the Global 6500, but costs US$36.5 million more and falls 858 nm short of Auckland. The ACJTwoTwenty, priced within US$2.1 million of the G800, gives up nearly 2,500 nm of range to it and falls 776 nm short of Sydney. What both buy is cabin: 78 to 86 ft of cabin length and 10.8 to 11.6 ft of width, against 47 ft and 8.2 ft for the G800 (BCA net cabin figures). They fit missions where cabin volume, entourage size or a head-of-state profile outweighs nonstop range, with a fuel stop planned.
Final aircraft selection should rest on the mission profile, a productivity index (range, cabin volume and speed, normalized against price) and a weighted composite score, cross-checked against airframe-specific indicators such as cycles, hours and configuration.
Conclusion and Recommendations
The Southwest Pacific shows why premium seat capacity should be read as a structural signal, tiered rather than ranked: two anchor corridors, two accelerating mid-tier corridors, one wealth-signal corridor at inflection and one first-mover market. Four recommendations follow.
First, commit where density is proven. Sydney and Melbourne justify direct client relationships and dedicated basing today.
Second, build selectively in Brisbane and Perth. Use channel partners and opportunistic capacity but defer new fixed commitments until Q4 2026 load-factor and frequency data confirm the trend.
Third, treat Auckland as a leading indicator, not a laggard. Position ahead of scheduled capacity, and plan for a fuel stop or specify G800/Global 8000-class range for a genuine nonstop.
Fourth, buy for timing. With OEM backlogs measured in years, the pre-owned G650ER pool offers the most practical entry. For new orders, specify the G800 if Auckland is in the mission set, and the Global 6500 if it is not. Consider an airliner-derived VIP jet only when cabin outweighs range per dollar, and plan a fuel stop for Auckland.

René Armas Maes is a Strategic Advisor at Forecast International, where he leads the Airborne Retrofit & Modernization Forecast portfolio across commercial aviation, business aviation, helicopters, and military platforms.
He brings 20 years of international experience driving revenue growth, commercial strategy, and margin improvement across airlines, business aviation, charter operations, OEMs, and aviation services.
A published author with more than 175 articles and market analyses in AvBuyer, FlightGlobal, AeroTime, Forecast International, and REDD Intelligence, René writes on commercial strategy, aviation economics, fleet planning, business restructuring, market intelligence, and capital allocation, and maintains an active business aviation blog.
Throughout his career, he has held senior commercial leadership positions at Airbus, Textron Aviation, and IATA. Earlier, as a consultant with ICF Aviation/SH&E in New York, he advised airline and business aviation clients on strategy and restructuring initiatives including Kuwait Airways, Saudia Airlines, Flynas and RoyalJet Group in Abu Dhabi, UAE – a leading VVIP business aviation operator in the Middle East.