
Challenger 650 – Photo Credit: Bombardier
The Falcon 900LX and Challenger 650 sit at opposite ends of a large-cabin segment that, on 2026 data, now spans nearly $19 million in list price between its cheapest aircraft (Challenger 650, $35.5M) and its most expensive (Gulfstream G500, $54.25M). The F900LX and Challenger 650 aren’t the extremes, but they anchor the question this article asks: does a real capability gap between two aircraft translate into a proportionate value gap for the people who own, fly, sell, and finance them? That question sits underneath every spec-sheet comparison in this segment, and it’s the one the four lenses below are built to answer directly.
A critical development complicates that question before the four lenses even start. Records suggest the last new-build Falcon 900LX airframe entered production around July 2025, with no new units recorded in the thirteen months since; Dassault’s own marketing site no longer lists the F900LX on its primary aircraft lineup; and industry brokers now describe 2026 as the model’s final delivery year. For a spec-sheet comparison, that’s a footnote. For the four lenses that follow especially the buyer, seller, and financier who have to price collateral and residual value years out, it’s closer to the whole story: an aircraft nearing the end of production carries a different risk profile than one a manufacturer is still actively building, no matter how the two compare on paper today.
Productivity Index and Composite Competitiveness Analyses
Chart 1 puts this article’s two subject aircraft in context before the four lenses take over. On raw capability, the Falcon 900LX carries a real edge: a Productivity Index of 2.59 against the Challenger 650’s 1.94, a 33% advantage built on longer range and a larger cabin. That capability comes at a price, though: the F900LX lists at $45.5M against the Challenger 650’s $35.5M, a 28% premium smaller than the PI gap, but not by much. The F2000LXS, the only other aircraft this chart includes, sharpens the point from a different angle: it costs more than the Challenger 650 ($38.3M against $35.5M) while scoring lower on PI (1.80 against 1.94), meaning the Challenger 650 isn’t just this field’s cheapest aircraft, it’s arguably its best value on a capability-per-dollar basis. The G400 and G500 sit further up the chart only as a ceiling: a reminder of what a Falcon 900LX-level premium is theoretically buying against, not aircraft this article compares head-to-head.
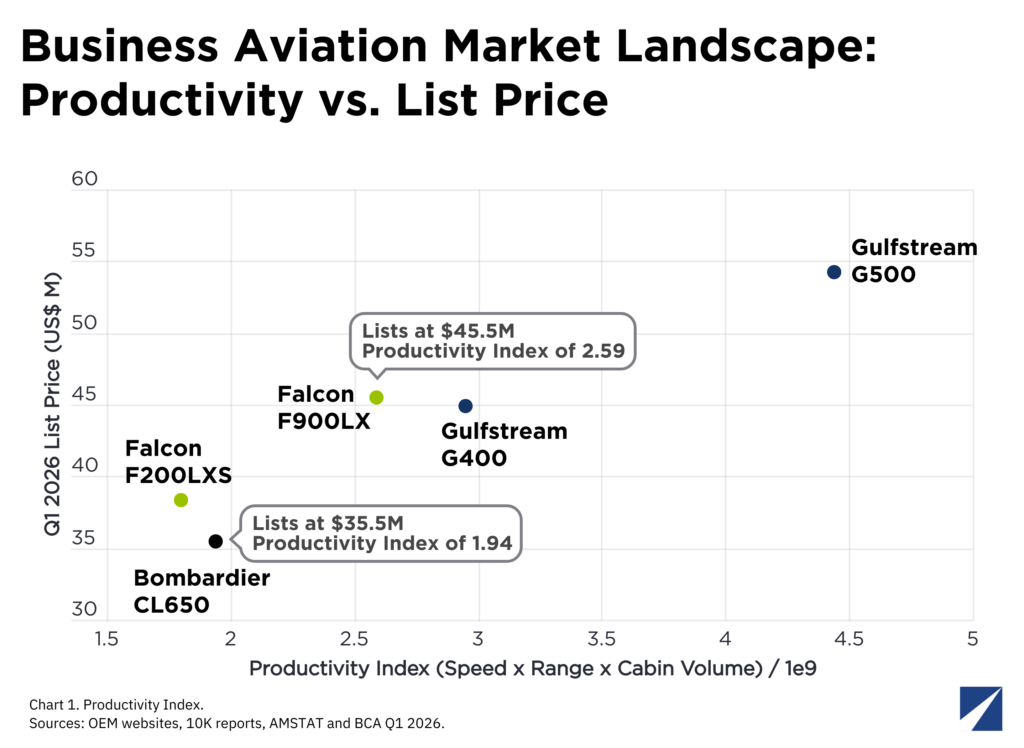
Chart 1. Productivity Index. Sources: OEM websites, 10K reports, AMSTAT and BCA Q1 2026.
That 33%-capability-for-28%-price trade reads like a reasonable deal on paper or capability outpacing cost. Whether it actually is depends entirely on who is asking, which is exactly the gap the four lenses below are built to close. A charter customer paying by the hour experiences that 33% differently than an owner-operator financing the aircraft for seven years, and differently again from a lender assessing what either aircraft is worth as collateral in year seven.
Chart 2 forces the same aircraft into one Composite Competitiveness Score rather than a single axis, blending Productivity Index (40%), range (25%), cabin volume (20%), and speed (15%) after rescaling each to a common basis. The weighting favors raw capability by design: almost two-thirds of the score comes from PI and range alone, since those are the two dimensions a charter customer or owner-operator tends to price into a decision before comfort or speed enter the conversation.
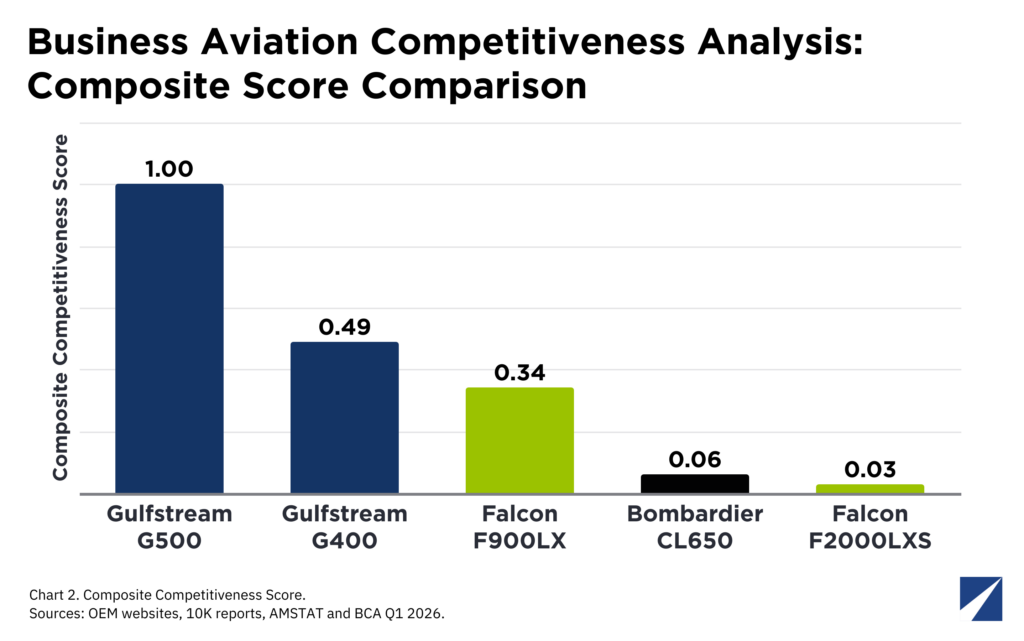
Chart 2. Composite Competitiveness Score. Sources: OEM websites, 10K reports, AMSTAT and BCA Q1 2026.
On this composite basis the F900LX pulls further ahead of the Challenger 650 than the PI comparison alone suggested, since its range and cabin-volume advantages compound rather than offset each other. That widening gap matters heading into the four lenses: the operating-economics reversal the next section documents is not the Challenger 650 closing a small capability gap, it is holding its own against an aircraft that outscores it more, not less, once range and cabin are weighted in.
However, the Productivity and Composite Competitiveness Index Scores say nothing about who actually captures or bears the value of that capability, and the four parties who touch these aircraft across their life cycle do not experience the F900LX-versus-CL650 choice the same way.
Four Lenses of Value
The Charter Owner-Operator: Under the operating-cost data (AMSTAT, July 2026), this lens favors the Challenger 650. At 400 annual flight hours, the Challenger 650 generates a seven-year net operating cash flow with a present value of $4.3 million, while the F900LX’s higher fixed and variable costs (consistent with three-engine maintenance complexity) push its equivalent figure to roughly negative $0.65 million. The Challenger 650 also reaches operating break-even at a far lower annual hours against the F900LX, meaning the F900LX does not cover its fixed costs at the 400-hour assumed base case.
The Prospective Charter Customer: The customer buying a seat, not the aircraft, cares about price per unit of capability. On that basis the Falcon 900LX screens better, delivering more nautical miles of range per charter dollar and a lower rate per passenger seat, consistent with its stronger Productivity Index score. The Challenger’s wider cabin and shorter typical mission profile, however, mean this comparison undersells it for customers whose priority is domestic comfort over intercontinental range, a distinction the Index, weighted toward speed and range, does not fully capture.
The Buyer and Seller: The Challenger 650 retains a materially higher share of its own list price in the pre-owned market (roughly 68% against 53% for the Falcon 900LX) and public listings show a tighter fleet, with AMSTAT reporting as of August 15, 2026, only 1.6% of in-service Challenger 650s listed for sale or lease versus 2.0% for the Falcon 900LX. A tight listed-for-sale percentage combined with superior value retention means the Challenger 650 is now the stronger transactional asset on both counts, not just market tightness a reminder that “which aircraft is better” depends on who is asking, but increasingly the Challenger 650 is winning more of those audiences.
The Financier and Lessor: A lender cares about collateral durability more than operating cash flow or liquidity. At an illustrative 70% loan-to-value, the Challenger 650’s year-seven residual value covers its loan balance at roughly 1.00 times (an adequate cushion) while the Falcon 900LX’s steeper depreciation assumption leaves it at only roughly 0.83 times coverage, a shortfall a conservative lender would flag.
Building the Case: F900LX vs. Challenger 650
The seven-year model follows a Year 0 pre-owned acquisition at each type’s current average transaction price, seven years of charter revenue net of operating costs, a Year 1 tax shield from 100% bonus depreciation under the 2025 tax legislation for a qualifying Part 135 operator, and a Year 7 disposal at an estimated residual value net of broker commission, all discounted at an 8% weighted average cost of capital.
Set against a Falcon 900LX acquisition, choosing the Challenger 650 avoids roughly $6.84 million of incremental seven-year value destruction, composed of an estimated $5.0 million better net operating cash flow and a stronger residual position, partially offset by a modestly lower Year 0 acquisition and transaction cost that would otherwise have masked how much the F900LX’s ongoing cost structure and depreciation trajectory work against it.
Sensitivity analysis reinforces this: at the high-utilization case (550 hours/year), the Challenger 650’s NPV turns slightly positive (approximately $0.84 million), while the F900LX’s NPV remains deeply negative (approximately negative $7.59 million) even at that utilization level meaning higher utilization alone cannot rescue the F900LX’s economics under the cost assumptions built, whereas it is sufficient to make the Challenger 650 value-accretive.
Stress-Testing the Assumptions
Three assumptions carry more weight than the presentation above admits. First, the depreciation rates used (7.0% annually for the Falcon 900LX and 4.5% for the Challenger 650) reflect the F900LX’s apparent production wind-down and were derived from a blended-fleet approximation (the ratio of pre-owned average price to new list price, annualized over each model’s production run and adjusted directionally for the discontinuation evidence) and not from an observed vintage-by-vintage curve of the kind AMSTAT or Aircraft Bluebook would provide.
That is a directional adjustment, not a forward forecast, and it could still be wrong in either direction: it may understate the F900LX’s risk if buyers price in discontinuation faster than a smooth annual rate implies (an end-of-production “cliff” effect rather than gradual depreciation), or it may overstate it if Dassault’s decades-long practice of supporting out-of-production Falcons (as with the Falcon 20 and 50 series) reassures the market faster than expected.
Second, the charter rate and utilization figures modeled are averages of publicly advertised broker rates rather than operator-specific contracted data.
Third, the Falcon 900LX’s 2.0% active-fleet-for-sale figure (AMSTAT, July 2026) is lower than might be expected for a discontinued platform, which could mean owners are not yet reacting to the production news.
What the Analysis Missed
Three angles sit outside the scope of this analysis. The Productivity Index weights speed, range, and cabin volume equally by multiplication, which rewards balanced aircraft and penalizes a platform, like the Challenger 650, deliberately optimized for cabin comfort over range and speed; a customer-segmented index (one version weighted toward comfort and another toward range) would likely reorder the competitive set for part of the buyer population.
Financing was modeled only as a simple loan-to-value check; a full financier lens would also weigh lease-return risk, engine-program enrollment as a value-preservation lever, and the two aircraft’s differing maintenance complexity, three engines against two, which affects both direct cost and insurance underwriting in ways this model did not price.
Finally, this analysis does not address substitution risk from institutional fleet disposals; when fractional and charter operators eventually refresh their own large-cabin fleets, the resulting wave of pre-owned inventory could compress the Challenger 650’s residual value in particular, below the assumptions modeled, a systemic risk that could penalize the Challenger 650 given institutional fleet sales appetite.
Beyond the three angles above, four further considerations sit outside this analysis’ current scope. First, parts and product-support continuity for the F900LX’s existing operator base is now a live question rather than a hypothetical one; Dassault has historically supported out-of-production Falcons for decades, but buyers and financiers should confirm this commitment explicitly rather than assume it, since support-continuity risk is a direct driver of the collateral and residual assumptions.
Second, a shrinking type-rated pilot and MRO-technician pool is a slow-moving but real risk for a discontinued platform that this model does not price, and it typically shows up years after production ends rather than immediately.
Third, end-of-production aircraft sometimes see a short-term scarcity premium for late-build, low-time airframes before the longer-run depreciation risk dominates, a nuance that could temporarily mask the steeper depreciation modeled for the newest F900LX units specifically.
Fourth, an Environmental, Social, and Governance (ESG) and emissions lens is increasingly relevant to corporate flight departments with fleet emissions targets: the F900LX’s three-engine configuration burns more fuel per passenger-mile than the Challenger 650’s twin, a factor this analysis has not quantified but which could accelerate the F900LX’s disadvantage among ESG-sensitive charter customers and corporate buyers independent of the cost economics modeled above.
Conclusion
No single answer to “F900LX or CL650” survives contact with all four lenses at once, but the balance shifted decisively toward the Challenger 650. When comparing the Falcon 900LX and the Challenger 650, the latter is the stronger asset on three of four lenses (charter owner-operator economics, buyer/seller transactional value, and financier collateral coverage) while the Falcon 900LX retains an advantage only on the prospective-charter-customer lens, where its superior range and speed still deliver more capability per charter dollar. On the collateral evidence alone, the Challenger 650 is the more conservative choice.
Two recommendations follow. Operators evaluating either aircraft should stress-test their own utilization forecast against the Falcon 900LX’s-hour and the Challenger 650’s-hour operating break-even thresholds since the Falcon 900LX’s economics do not work at typical light-owner-flown utilization levels under the cost assumptions made.
Prospective buyers and their financiers should commission actual AMSTAT or Aircraft Bluebook vintage-price data before underwriting either aircraft’s residual value and should explicitly confirm Dassault’s parts and product-support commitment for the F900LX given its apparent production status, since the depreciation assumptions used in this analysis are directional only.

René Armas Maes is a Strategic Advisor at Forecast International, where he leads the Airborne Retrofit & Modernization Forecast portfolio across commercial aviation, business aviation, helicopters, and military platforms.
He brings 20 years of international experience driving revenue growth, commercial strategy, and margin improvement across airlines, business aviation, charter operations, OEMs, and aviation services.
A published author with more than 175 articles and market analyses in AvBuyer, FlightGlobal, AeroTime, Forecast International, and REDD Intelligence, René writes on commercial strategy, aviation economics, fleet planning, business restructuring, market intelligence, and capital allocation, and maintains an active business aviation blog.
Throughout his career, he has held senior commercial leadership positions at Airbus, Textron Aviation, and IATA. Earlier, as a consultant with ICF Aviation/SH&E in New York, he advised airline and business aviation clients on strategy and restructuring initiatives including Kuwait Airways, Saudia Airlines, Flynas and RoyalJet Group in Abu Dhabi, UAE – a leading VVIP business aviation operator in the Middle East.