
Image: Bombardier Global 7500/8000 Factory
Part 1 (https://lnkd.in/ebQSmHXb) laid out the raw material behind this forecast: a six-OEM market where 1Q26 backlog growth ranges from 43% at Bombardier to roughly flat at Embraer and Textron; a US GDP correlation that only becomes meaningful once measured as growth-on-growth rather than growth-on-level (rising from a meaningless −0.28 to a real 0.50 correlation); and a group of manufacturers telling visibly different stories about their own near-term demand, with Bombardier and Gulfstream building backlog while Textron and Embraer grow revenue through pricing and mix instead of volume.
Part 2 turns that raw material into an actual forecast: the three-layer methodology used to build it, why it departs from standard industry practice, and what the resulting 2026-2030 numbers mean for owners, buyers, sellers, and financiers.
The Forecast Methodology: What It Covers, What Drives It, and Where It Departs From Standard Practice
The forecast covers the same six business jet OEMs across 2026 through 2030 and is built in three layers rather than one. The first layer is a run-rate baseline: the 2026 full-year figure starts from the confirmed first-half actual (317 units) and is annualized against the delivery pattern actually observed in 2025, in which the first half accounted for 42% of the year and the fourth quarter alone was the heaviest.
The second layer replaces a single industry-wide growth assumption with six separate ones, one per manufacturer, each set from that OEM’s own backlog and book-to-bill trajectory rather than a blended market rate which represents the logic set out earlier, where Bombardier’s 43% backlog growth and Embraer’s flat backlog are treated as two different forecasts rather than averaged into one.
The third layer is the cyclicality overlay: rather than let the 2026-2029 growth trajectory run unchallenged through 2030, the model applies a segment-weighted historical recession shock, probability-weighted at 35% by default, so the published 2030 figure 741 units is a blend of a no-correction case 835 units and a correction case 566 units rather than a single point estimate presented with false precision. The interim years follow the same backlog logic: 2027 carries an explicit, sourced data point indicating Embraer and Textron could see delivery increases near 8% as 2026 order intake converts into hardware, while 2028-2029 assume growth decelerating to 3% and then 2% as backlogs normalize and pricing power for smaller aircraft approaches a peak.
Put together, Chart 1 shows the result: a forecast that rises from 751 units in 2026 to 776 in 2027 and 801 in 2028, reaching 819 in 2029, before the modeled correction pulls 2030 back to about 741, a shape a straight-line extrapolation of the 2023-2025 recovery would never produce.
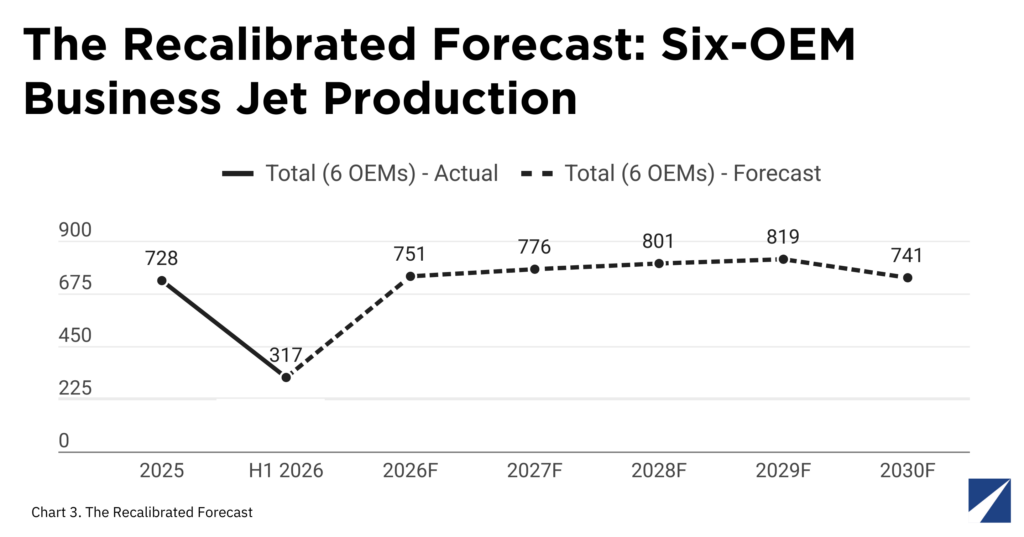
Chart 1. Six-OEM Total Business Jet Production, 2025-2030F. Total forecast units per year across all six OEMs. Solid line = Actual (2025 and 1H 2026). Dotted line = Forecast. Note: H1 2026 is a half-year figure, not annualized
That structure is a deliberate departure from the two dominant approaches used elsewhere in the industry. The first, and by far the most common in OEM investor materials and trade-press delivery outlooks, is a smooth extrapolation of recent growth held constant for three to five years. That approach is easy to communicate but is inconsistent with every downturn the six-OEM group has actually experienced, and it typically applies one growth rate to the entire market rather than recognizing that Bombardier and Textron are, in the first half of 2026, telling visibly different stories about their own forward demand.
The second approach, exemplified by Forecast International’s own published methodology, is more sophisticated: it explicitly models a downturn on the assumption of a roughly ten-year economic cycle and applies segment-specific historical decline magnitudes, 35% for light jets, 45% for mid-size, 10% for heavy, in this analysis rather than pretending cycles do not exist.
Intuition suggests light jets, as the more discretionary, entry-level segment, should be the most exposed to a downturn. Forecast International’s own historical analysis says otherwise: across the dot-com, Global Financial Crisis, and COVID downturns, mid-size jets averaged a 43% production decline versus 38% for light jets, which is why this model weights mid-size the heaviest of the three segments (45%) rather than light jets (35%).
Two dynamics likely explain the gap. Light-jet demand sits closer to a floor of necessity (entry-level charter, first-time owners who have already committed to flying, flight training, etc.) while mid-size buyers are more often choosing to step up from a smaller aircraft or expand a fleet, a decision that is easier to simply postpone.
And the light segment has long been anchored by a single dominant, loyal-demand program: the Phenom 300, the best-selling light jet for 13 consecutive years, was actually countercyclical during COVID, rising from 51 units in 2019 to 59 in 2022, which held the segment’s average up even as competitors struggled. The result is a forecast that weights its recession sensitivity by what the data actually shows, not by which segment looks more exposed on paper.
The Upside Case: Where This Forecast Could Run Higher
This forecast is worth being explicit about the conditions under which a higher trajectory could still play out. If backlog-to-delivery conversion runs at the pace originally implied by 1Q26 order data, rather than the scaled-back pace used here, production could land roughly 2% to 7% above this baseline by 2029, with the gap widening in the later years as the calibration compounds. Three conditions would support that upside: supply-chain and completions capacity easing faster than currently assumed, letting OEMs convert backlog into deliveries without further delay; fractional and charter demand holding at or above its current pace rather than moderating, sustaining the order momentum behind Bombardier’s and Gulfstream’s backlogs; and Dassault’s Falcon 10X certification and ramp landing on or ahead of schedule.
None of these is the base case. Each assumes a friction the industry has actually shown, twice this decade, that it doesn’t clear on schedule, supply chains, program timelines, and demand cycles have all disappointed before, which is precisely why this model discounts the original pace rather than assumes it. The baseline here reflects what OEMs’ own backlog conversion has actually delivered, not what it could deliver if every constraint broke favorably at once. That is what makes it a central estimate rather than a ceiling: the upside is real, but it requires several independent things to go right simultaneously, while the baseline only requires the recent pattern to continue.
The New Variable Nobody’s 2019 Forecast Accounted For: Fractional Fleets
One structural change deserves more attention than it has received: fractional and program-operator ordering now dominates forward demand. Embraer’s Praetor 500/600 line alone reportedly carries more than 400 potential sales tied to NetJets and Flexjet, while Bombardier’s Challenger 3500 and Global 6500/8000 have picked up nearly 300 orders from NetJets, Bond and Vista Global. In one sense, this is exactly the demand visibility a capital-intensive manufacturer wants; Bombardier and Gulfstream can plan years ahead with unusual confidence.
But it also concentrates the market’s fate in a handful of very large buyers, and the industry has already seen what that can cost: Wheels Up’s 2024-2025 fleet-disposal strategy, which put 70+ used Textron jets onto the secondary market as the company retrenched, was not a demand-side shock at all, it was one operator’s business model outrunning its own fleet economics and it still moved pre-owned-aircraft pricing and depressed order visibility for the affected types. A forecast that treats fractional backlog as simply additive to demand, without asking how concentrated and financially resilient that demand is, misses part of the risk picture.
What This Forecast Means for Aircraft Owners, Buyers, Sellers and Financiers
These dynamics play out differently depending on which side of the transaction a reader sits on. For a prospective buyer of a new aircraft, tight backlogs mean pricing should stay firm through 2027-2028, so a buyer with a genuine near-term need should expect to compete for a delivery slot; a buyer with flexible timing may find a 2029-2030 order position, closer to our modeled correction window, may carry more negotiating leverage.
For an owner considering a sale, the picture diverges sharply by class. According to AMSTAT, as of the end of June 2026, 6.5% of the active jet fleet was listed for sale, below the 10-year average of 8.1% and at the lowest level since August 2023. Heavy jets have outperformed every segment, with retail transactions up 16% through the first half of 2026 even as light-jet values have softened modestly. A heavy-jet owner is selling into a genuine seller’s market; a light-jet owner may not see a materially better window ahead of our modeled 2030 correction.
For a financier or lessor, the concentration of forward orders in a handful of fractional programs is the detail most worth re-underwriting: residual-value assumptions built on a broad base of individual owners no longer describe Bombardier’s Challenger 300/350/3500 family, where fleet-operator concentration among the top ten owners reaches more than 25%, or, to a lesser but still material degree. Textron’s Citation line, at close to 20%. A lender extending credit against those airframes should ask what happens to collateral value if one of those programs restructures.
For charter and fractional operators themselves (simultaneously the industry’s largest buyers are the most exposed potential sellers if travel demand ever reverses) locking in delivery positions now secures capacity through the next cycle but adds fleet-financing exposure at precisely the point in the cycle where it would be hardest to unwind cheaply.
Conclusion
Business jet production is recovering, but not in the smooth, linear way most published forecasts assume.
We built this methodology because most published business-jet forecasts optimize for a different goal than we do: a single, easy-to-communicate growth rate carried forward for several years. That works well when the object is a clean headline number. Ours is built for a different use case, one where the timing of a cycle and the divergence between manufacturers are themselves the decision-relevant information, so we chose not to smooth them away.
Averaging a projected decline evenly across the forecast horizon, for instance, would make the top-line curve tidier, but it would blur exactly when risk concentrates and understate how differently Bombardier, Gulfstream, Textron, Embraer, Dassault and Pilatus are each positioned heading into it.
That is a design choice, not a correction. Twenty-five years of production data show cycles that are real, uneven across OEMs, and rarely linear, and a forecast earns more trust when it shows that structure rather than compresses it into one confident-looking line. The six-OEM business jet market today reflects exactly this: it is not in the midst of either a straightforward recovery or an impending collapse; it is in a normal cyclical expansion likely to run another two to three years before facing renewed pressure.
Bombardier and Gulfstream have built backlog cover that should let them hold pricing and production discipline into 2028 regardless of near-term macro noise; Textron and Embraer are converting a flatter backlog into revenue growth through product mix and pricing rather than volume, a materially different and, in a downturn, more fragile position; and the industry as a whole has become more dependent than at any point in the last fifteen years on a small number of fractional and charter operators whose own financial discipline, not overall travel demand, may prove the more decisive variable for production rates in 2028-2030.
Owners, buyers, sellers and financiers who treat this as one undifferentiated market will miss most of what matters in this cycle. Those who instead track the backlog divergence between manufacturers, the segment-level resilience patterns that have held through three prior downturns, and the concentration risk building inside the fractional order book will be considerably better positioned for whatever the next four years bring.

René Armas Maes is a Strategic Advisor at Forecast International, where he leads the Airborne Retrofit & Modernization Forecast portfolio across commercial aviation, business aviation, helicopters, and military platforms.
He brings 20 years of international experience driving revenue growth, commercial strategy, and margin improvement across airlines, business aviation, charter operations, OEMs, and aviation services.
A published author with more than 175 articles and market analyses in AvBuyer, FlightGlobal, AeroTime, Forecast International, and REDD Intelligence, René writes on commercial strategy, aviation economics, fleet planning, business restructuring, market intelligence, and capital allocation, and maintains an active business aviation blog.
Throughout his career, he has held senior commercial leadership positions at Airbus, Textron Aviation, and IATA. Earlier, as a consultant with ICF Aviation/SH&E in New York, he advised airline and business aviation clients on strategy and restructuring initiatives including Kuwait Airways, Saudia Airlines, Flynas and RoyalJet Group in Abu Dhabi, UAE – a leading VVIP business aviation operator in the Middle East.