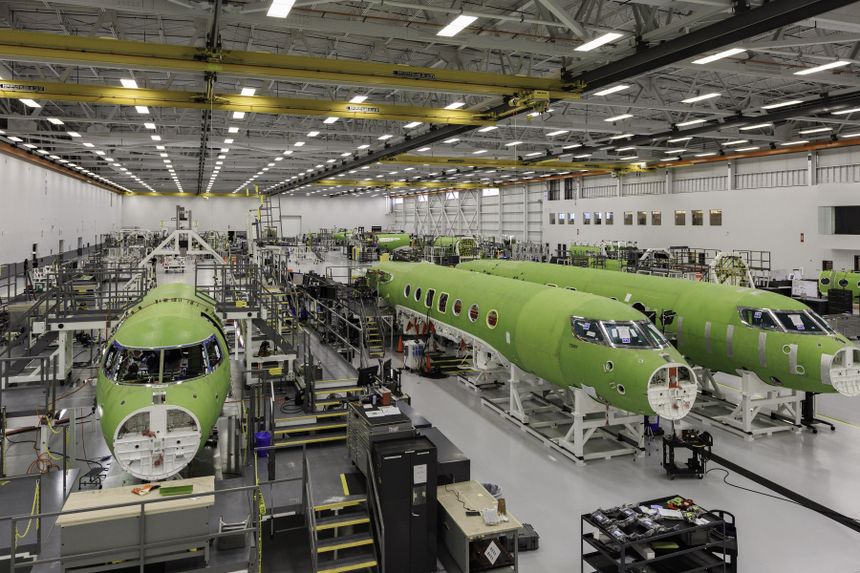
Across the six manufacturers that dominate the business jet market (Bombardier, Gulfstream, Embraer, Textron Aviation, Dassault Falcon and Pilatus) deliveries totaled 728 aircraft in 2025 and 317 in the first half of 2026, a pace that puts full-year 2026 production on track for roughly 765 to 770 units, 6% growth when benchmarked against 2025. That is actually about 12% above the pre-pandemic 2019 level of 684 units yet still nearly 42% below the 1,317-unit peak reached in 2008, a reminder of how much further a genuine boom can run before it corrects.
What makes the current cycle worth examining is not the headline number but its composition: Bombardier’s backlog grew 43% year over year in the first quarter of 2026 (Bombardier Q1 2026 press release April 2026), and Gulfstream’s grew 17% (General Dynamics 10Q report 2026), while Textron’s backlog rose just 1% (Textron Inc. 8K report 2026) and Embraer’s was essentially flat (Embraer S.A. 6K report 2026) even as its company-wide quarterly revenue climbed more than 30% on pricing and product mix. Those are four different stories being told by four manufacturers in the same market, and any forecast that reduces them to a single industry-wide growth rate discards the most useful information available.
This article lays out a production forecast through 2030 built from that OEM-level backlog data, explains why 2030 is modeled as a probability-weighted cyclical correction rather than a simple continuation of the current upswing, and works through what the resulting picture means for an aircraft owner, a prospective buyer, a seller and a financier, four parties reading the same data who should, in several cases, draw quite different conclusions from it.
A Quarter-Century of Booms and Corrections
Business jet production has never behaved like a stable, steadily growing industry with an occasional soft patch; it has behaved like a genuinely cyclical one, and twenty-five years of data make that case unambiguously. Deliveries for those six business jet OEMs climbed through the mid-2000s, roughly tracking the broader US economy, before rocketing from 887 units in 2006 to 1,317 in 2008 as a pre-crisis credit and wealth boom pulled orders forward.
The correction that followed was brutal: production fell 34% by 2009, nearly halved from its 2008 peak by 2012, and has not approached that peak again in the seventeen years since – even our 2029 forecast of roughly 872 units sits a third below it. A milder dip followed the 2011-2013 European debt strain, and a third, swifter but shorter-lived interruption arrived with COVID-19 in 2020, when deliveries fell to 533 units before staging one of the fastest recoveries in the industry’s history.
Commercial aircraft manufacturing does not behave this way. As Forecast International has noted, narrowbody and widebody deliveries actually rose during 2008-2009, because airlines defer retirements rather than cancel firm orders and OEMs can reallocate slots without disrupting output.
Business jets carry no such buffer: two-to-three-year order-to-delivery lead times, a customer base split between discretionary high-net-worth purchases and deferrable corporate capital decisions, and a resale market that reacts almost immediately to sentiment, all make the segment far more elastic to the cycle. Across the dot-com correction, the global financial crisis and the pandemic, average declines ran roughly 38% for light jets, 43% for mid-size and super-mid-size jets, and just 15% for heavy, long-range and ultra-long-range aircraft, the heavy segment’s resilience reflecting its wealthier, less financially constrained buyer base and heavier corporate and sovereign weighting.
Does GDP Growth Actually Predict Business Jet Production?
A natural question for a cyclical durable-goods industry is whether its output simply tracks the broader economy. The instinctive test is to plot annual delivery counts against US real GDP growth, but doing so naively yields a same-year correlation of only −0.28 across 2000-2025, essentially no relationship, and if anything, a weak inverse one. That is not evidence the two are unrelated; it is evidence the comparison is malformed. A raw delivery count in any given year is a level that embeds several years of prior order momentum. For example, the 1,317 units delivered in 2008 reflect contracts signed in the hot 2004-2007 economy, not 2008 conditions, while GDP growth is a rate that resets every year.
Comparing a slow-moving level against a fast-resetting rate will rarely look correlated even when the underlying economics are related. The correct comparison, shown in Chart 1, is rate to rate: GDP growth against the year-over-year percentage change in business jet deliveries.
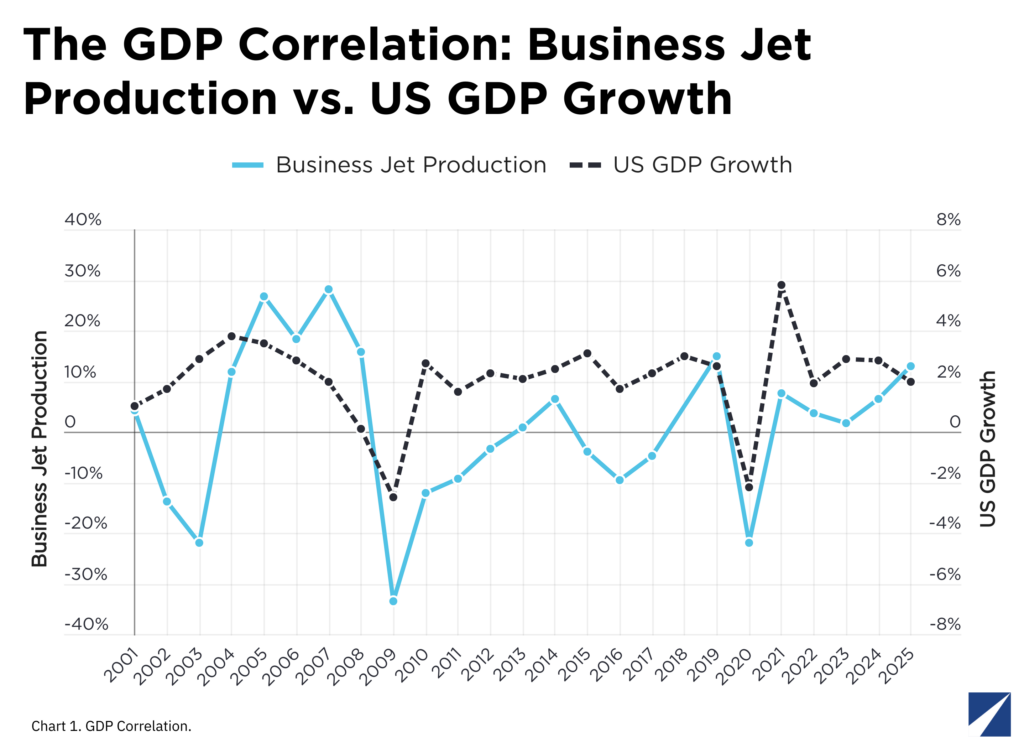
Chart 1. Business Jet Production Growth vs. US Real GDP Growth, 2001–2030F. Correlation r = 0.50, 2000-2025 actual
Measured that way, the correlation across 2000-2025 rises to 0.50, a real and moderate relationship, driven by exactly the periods intuition would predict: both series post their sharpest declines in 2009 and 2020, and both rebound together in 2021. However, Chart 1 is not tight enough to make GDP growth a precise predictive input on its own, a 0.50 correlation leaves most of the variance unexplained, and the two-to-three-year lag between order intake and delivery means any year’s production responds to economic conditions from several quarters earlier, not current ones but it is real, and it is why this forecast treats a US recession as a genuine production risk rather than a coincidental one. It is also why our forecasting model leans far more heavily on manufacturer-level backlog and book-to-bill data than on GDP growth itself. In other words, GDP growth is a background risk factor worth watching, not the forecast’s primary driver.
What the Backlog Data Is Actually Saying Right Now
The correlation between business jet production and US real GDP growth is visible across the full series, but it is a loose, lagged relationship rather than a tight one, and 2026 shows why GDP alone understates what is happening inside the industry.
US GDP growth has held fairly steady in a narrow 1.8 to 2.9% band across 2022–2030 (actual through 2025, forecast thereafter), offering little explanatory power for why one manufacturer’s backlog is growing faster than another’s. The more useful signal, and the one this analysis leans on most, is manufacturer-level backlog and book-to-bill data from first-quarter 2026 disclosures. Bombardier’s 43% backlog growth, driven by the Challenger 3500 and Global 7500/8000 family, is the strongest forward indicator in the group and suggests production could stay elevated into 2027-2028 without a single additional order.
Gulfstream’s 17% backlog growth tells a similar story as the G700 and G800 ramp normalizes after certification-driven volatility. Embraer and Textron are the more interesting cases precisely because their revenue is growing sharply (Embraer’s company-wide revenue was up more than 30% and Textron Aviation’s segment revenue was up 22% – Textron Inc. 8K report – in Q1 2026) even as their unit backlogs are flat to barely positive, the opposite pattern from Bombardier and Gulfstream, where backlog is growing faster than revenue.
That combination signals pricing and product mix gains. Embraer selling more Praetor 500/600 relative to smaller Phenoms, Textron shifting toward the Ascend and Latitude rather than genuinely accelerating unit demand, a distinction a revenue-only view would miss.
Meanwhile, Dassault Falcon is expecting to deliver 40 aircraft (Dassault Aviation 2025 Annual Results) in 2026 against 37 delivered in 2025, a figure that implies 8% growth. Reading these stories separately, rather than blending them into one industry number, is the single most important methodological choice here, and it is why our per-OEM 2026 growth assumptions range from 2% for Textron to 9% for Bombardier. That divergence is easiest to see laid out year by year, in Chart 2.
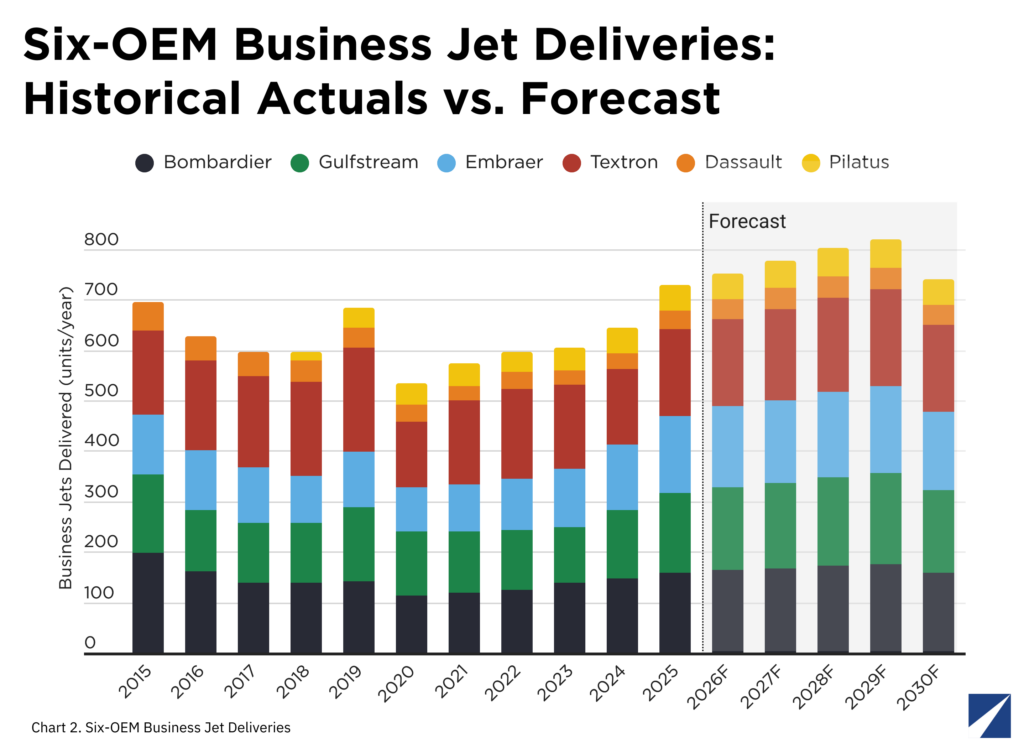
Chart 2. Six-OEM annual production, 2015-2025 actual and 2026-2030 forecast stacked by OEM.
Chart 2 makes plain what the backlog numbers above only imply: Textron and Bombardier have traded places at the top of the group twice since 2015, Embraer’s climb from a 2020 trough to parity with Gulfstream by 2025 is the steepest recovery of the six, and Dassault and Pilatus operate on an entirely different scale from the other four OEMs, small enough that a single program’s cadence (the Falcon line for Dassault, the PC-24 alone for Pilatus) can move their whole trajectory.
The lighter fill forecast bars do not converge toward a single shared slope either: Textron’s and Gulfstream’s projected paths pull further ahead of Bombardier’s by 2029. The 2030 dip shown for all six is a shared assumption, the same probability-weighted cyclical shock applied group-wide rather than a per-OEM prediction.
Conclusion
Six OEMs, one market, and starkly different backlogs: that is the picture the data paints before any forecasting model enters the discussion. Bombardier and Gulfstream are building order books at a pace that should carry them years into the future; Textron and Embraer are growing revenue through pricing and mix rather than volume; and US GDP growth, once measured correctly (as growth against growth, not growth against a raw delivery count), turns out to be a real but modest signal rather than the dominant driver much industry coverage assumes. None of this required a forecast to establish, it is what the backlog and delivery data already show.
Part 2 turns from what the data shows to how it becomes a forecast: the three-layer methodology behind the 2026-2030 numbers, why it departs from how most of the industry models a cycle, the counterintuitive finding on which cabin segment actually falls hardest in a downturn, the conditions under which the forecast could run higher than its baseline, and what the resulting numbers mean for buyers, sellers, financiers, and fractional operators navigating the years ahead.

René Armas Maes is a Strategic Advisor at Forecast International, where he leads the Airborne Retrofit & Modernization Forecast portfolio across commercial aviation, business aviation, helicopters, and military platforms.
He brings 20 years of international experience driving revenue growth, commercial strategy, and margin improvement across airlines, business aviation, charter operations, OEMs, and aviation services.
A published author with more than 175 articles and market analyses in AvBuyer, FlightGlobal, AeroTime, Forecast International, and REDD Intelligence, René writes on commercial strategy, aviation economics, fleet planning, business restructuring, market intelligence, and capital allocation, and maintains an active business aviation blog.
Throughout his career, he has held senior commercial leadership positions at Airbus, Textron Aviation, and IATA. Earlier, as a consultant with ICF Aviation/SH&E in New York, he advised airline and business aviation clients on strategy and restructuring initiatives including Kuwait Airways, Saudia Airlines, Flynas and RoyalJet Group in Abu Dhabi, UAE – a leading VVIP business aviation operator in the Middle East.