Overview
We have received several inquiries from clients and industry professionals regarding the methodology used in our business jet production forecasts. Specifically, questions have focused on the inclusion of a projected downturn in a future year based on our recession assumptions, so we are using this article to outline the reasoning behind this approach, the supporting historical analysis, and why our methodology differs from others in the sector.
Business Jet Production Forecast Methodology
Our forecasting approach is based on the historical relationship between macroeconomic cycles and business jet production. While the commonly cited claim that recessions occur every ten years is not entirely accurate when reviewing long-term FRED (Federal Reserve Economic Data) data, we apply a simplified model that assumes a ten-year economic cycle for forecasting purposes. Based on this assumption, our current forecast includes a production downturn in 2030, ten years following the most recent recessionary event.
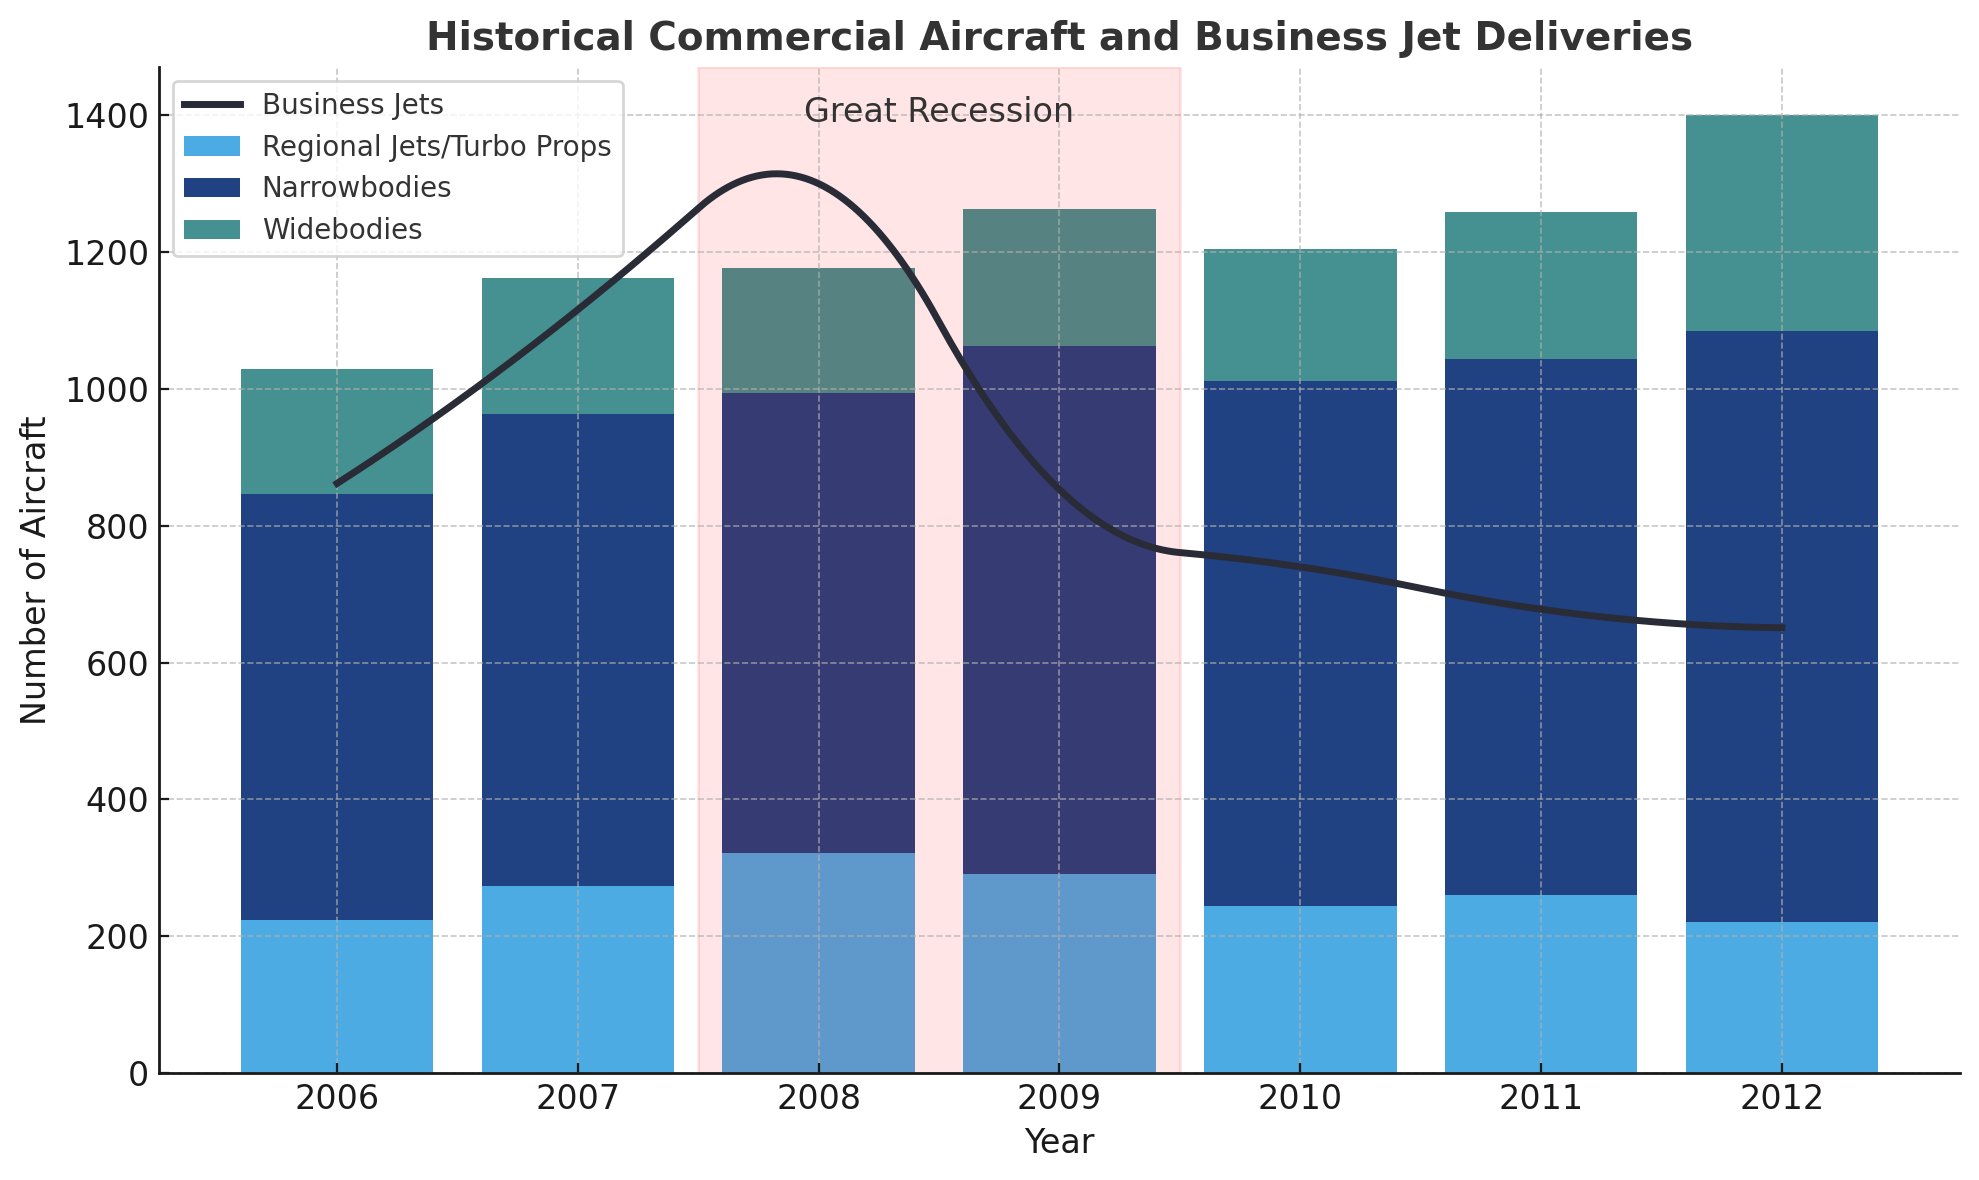
We also apply recession driven adjustments to our business jet forecasts but not to our commercial aircraft forecasts, because commercial aircraft programs have demonstrated production stability or even growth during economic downturns. For example, during the global financial crisis, deliveries of both narrowbody and widebody aircraft increased from 2008 to 2009. Narrowbody deliveries rose from 672 in 2008 to 772 in 2009, while widebody deliveries increased from 183 to 200 over the same period. This occurred despite the downturn being the most severe since the Great Depression. In such cases, OEMs can reallocate production slots without a material impact on production rates. Airlines also tend to retire older aircraft rather than cancel orders, recognizing that cancellations could be costly when demand returns, which further reduces the need for production cuts.
By contrast, business jet programs are more directly exposed to economic fluctuations due to their shorter order to delivery timelines, typically around two to three years, and because they represent both a discretionary purchase for high net-worth individuals and a significant expense for companies. As a result, production levels in this segment tend to be more sensitive to changes in demand during economic downturns.
Historical Data Analysis
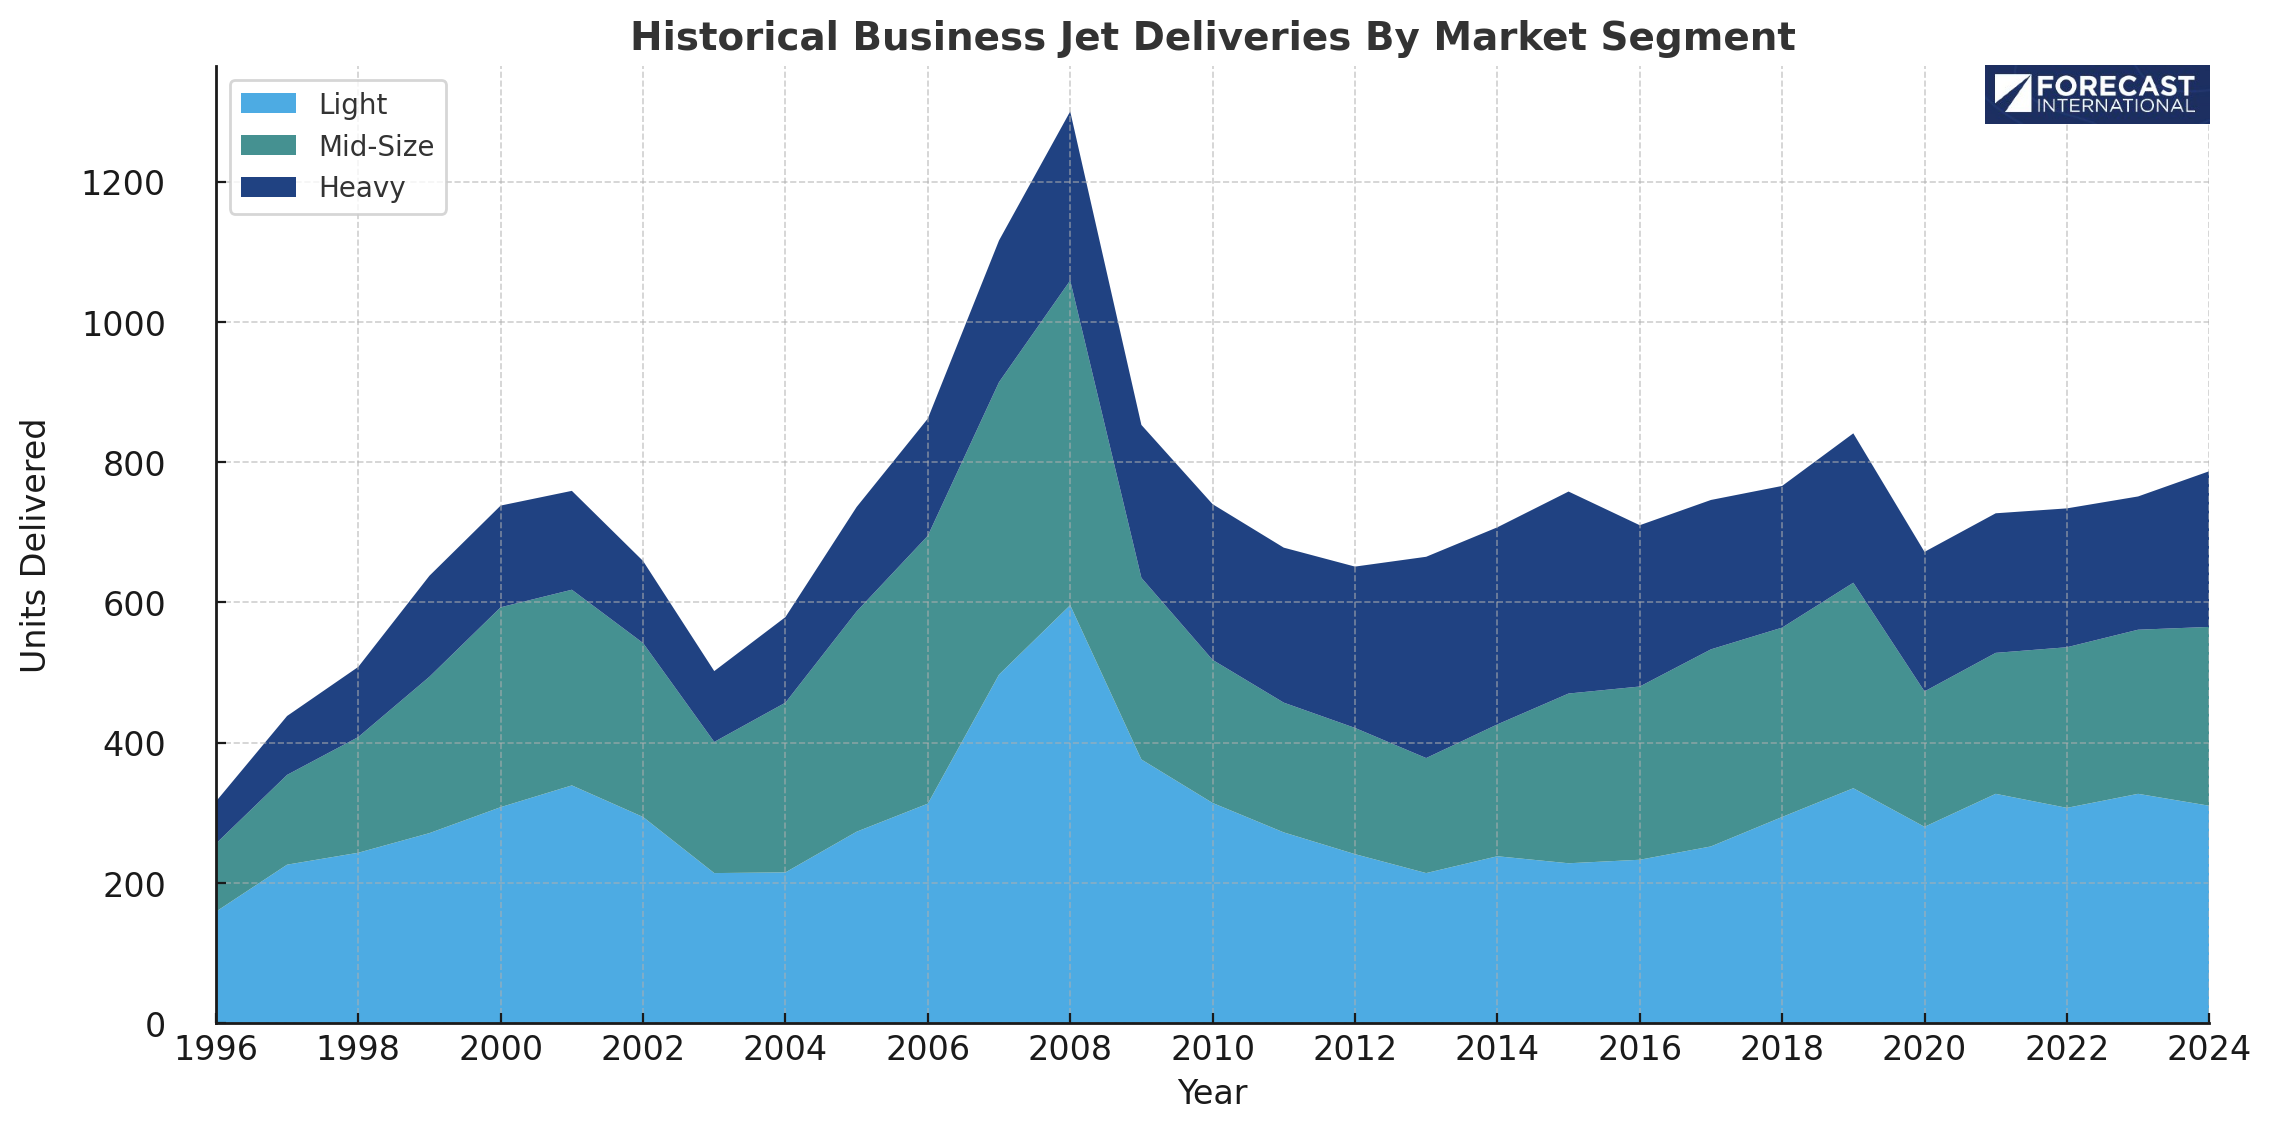
To support the inclusion of a forecasted downturn, we analyzed business jet production trends during previous economic contractions, including the dot com bubble, the global financial crisis and the COVID-19 pandemic. While we acknowledge that historical patterns do not guarantee future outcomes, this analysis provides a useful baseline for modeling expected future impacts.
The analysis divides the market into three categories: Light, Mid-Size, and Heavy jets. The Light category also includes very light jets such as the Eclipse 500 and Cirrus Vision Jet. The Mid-Size category includes super mid-size platforms, and the Heavy category includes Large Jets and Long Range and Ultra Long-Range business jets.
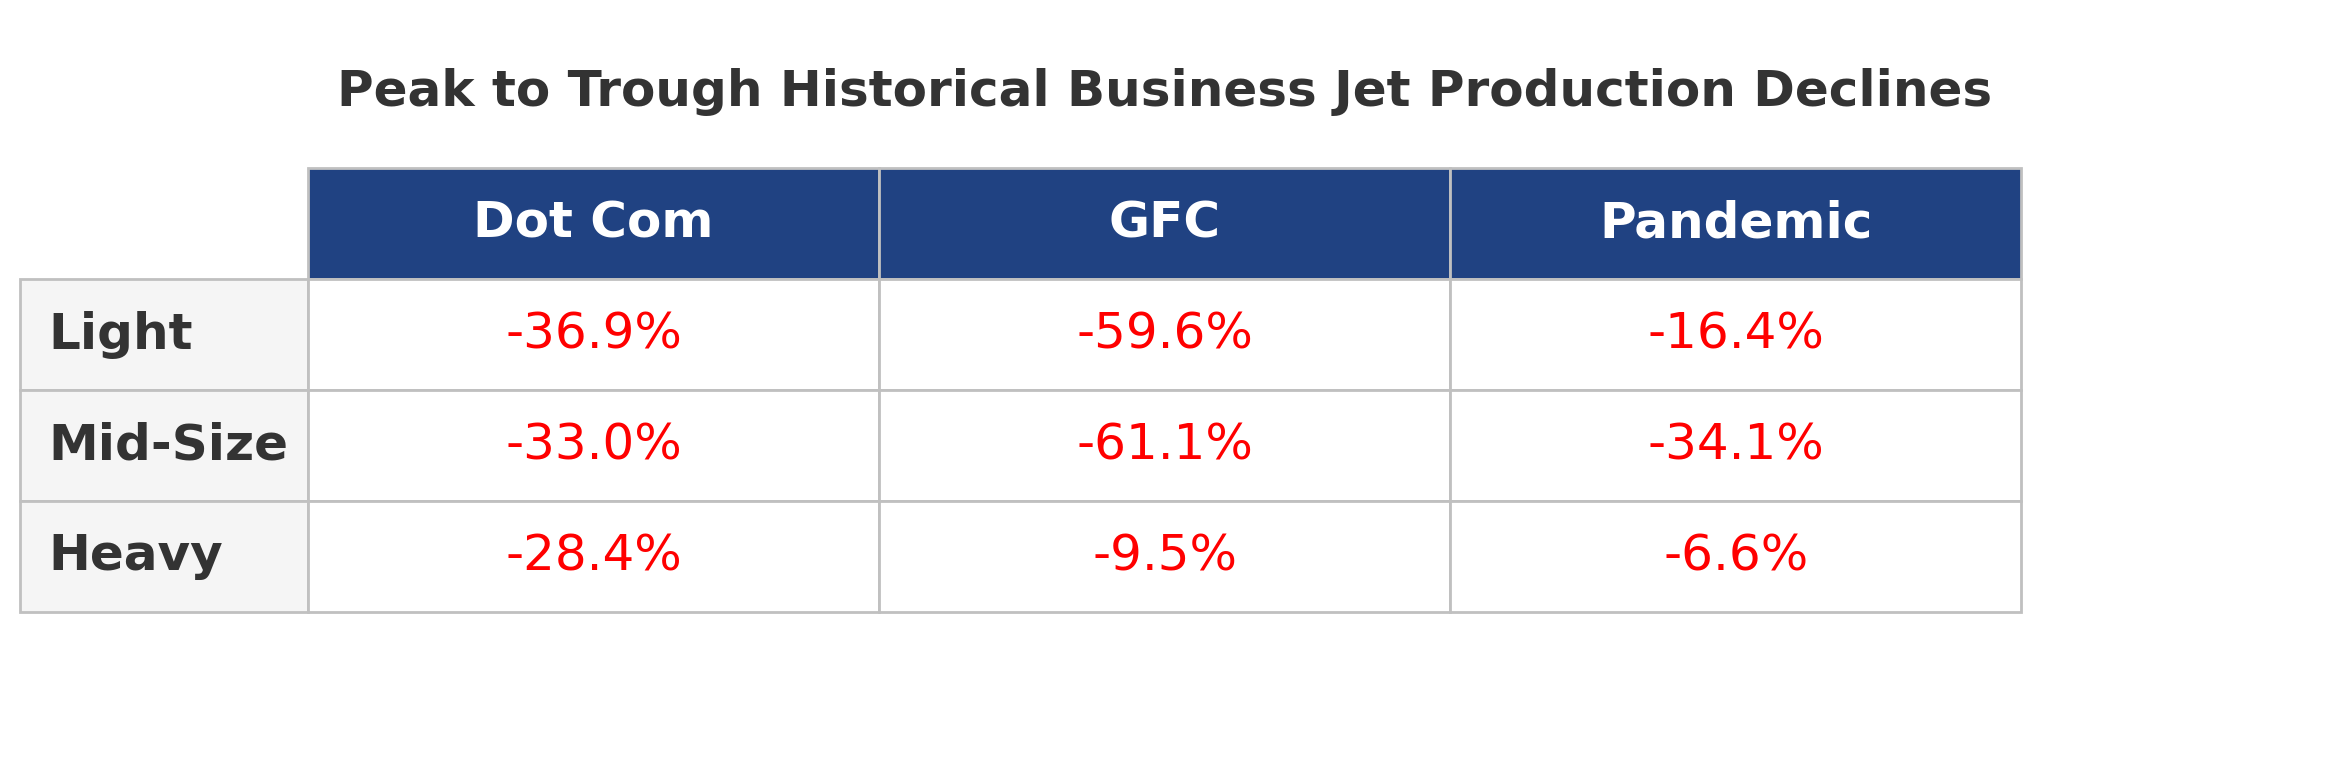
Historical average production declines during the Dot Com Bubble, the Global Financial Crisis, and the COVID-19 pandemic were as follows:
- Light jets: average decline of 37.6 percent
- Mid-Size jets: average decline of 42.7 percent, with a peak decline of 61.1 percent during the Global Financial Crisis
- Heavy jets: average decline of 14.8 percent, with individual downturns showing 28.4 percent (Dot Com Bubble), 9.5 percent (Global Financial Crisis), and 6.6 percent (Pandemic)
Segment Share and Production Sensitivity
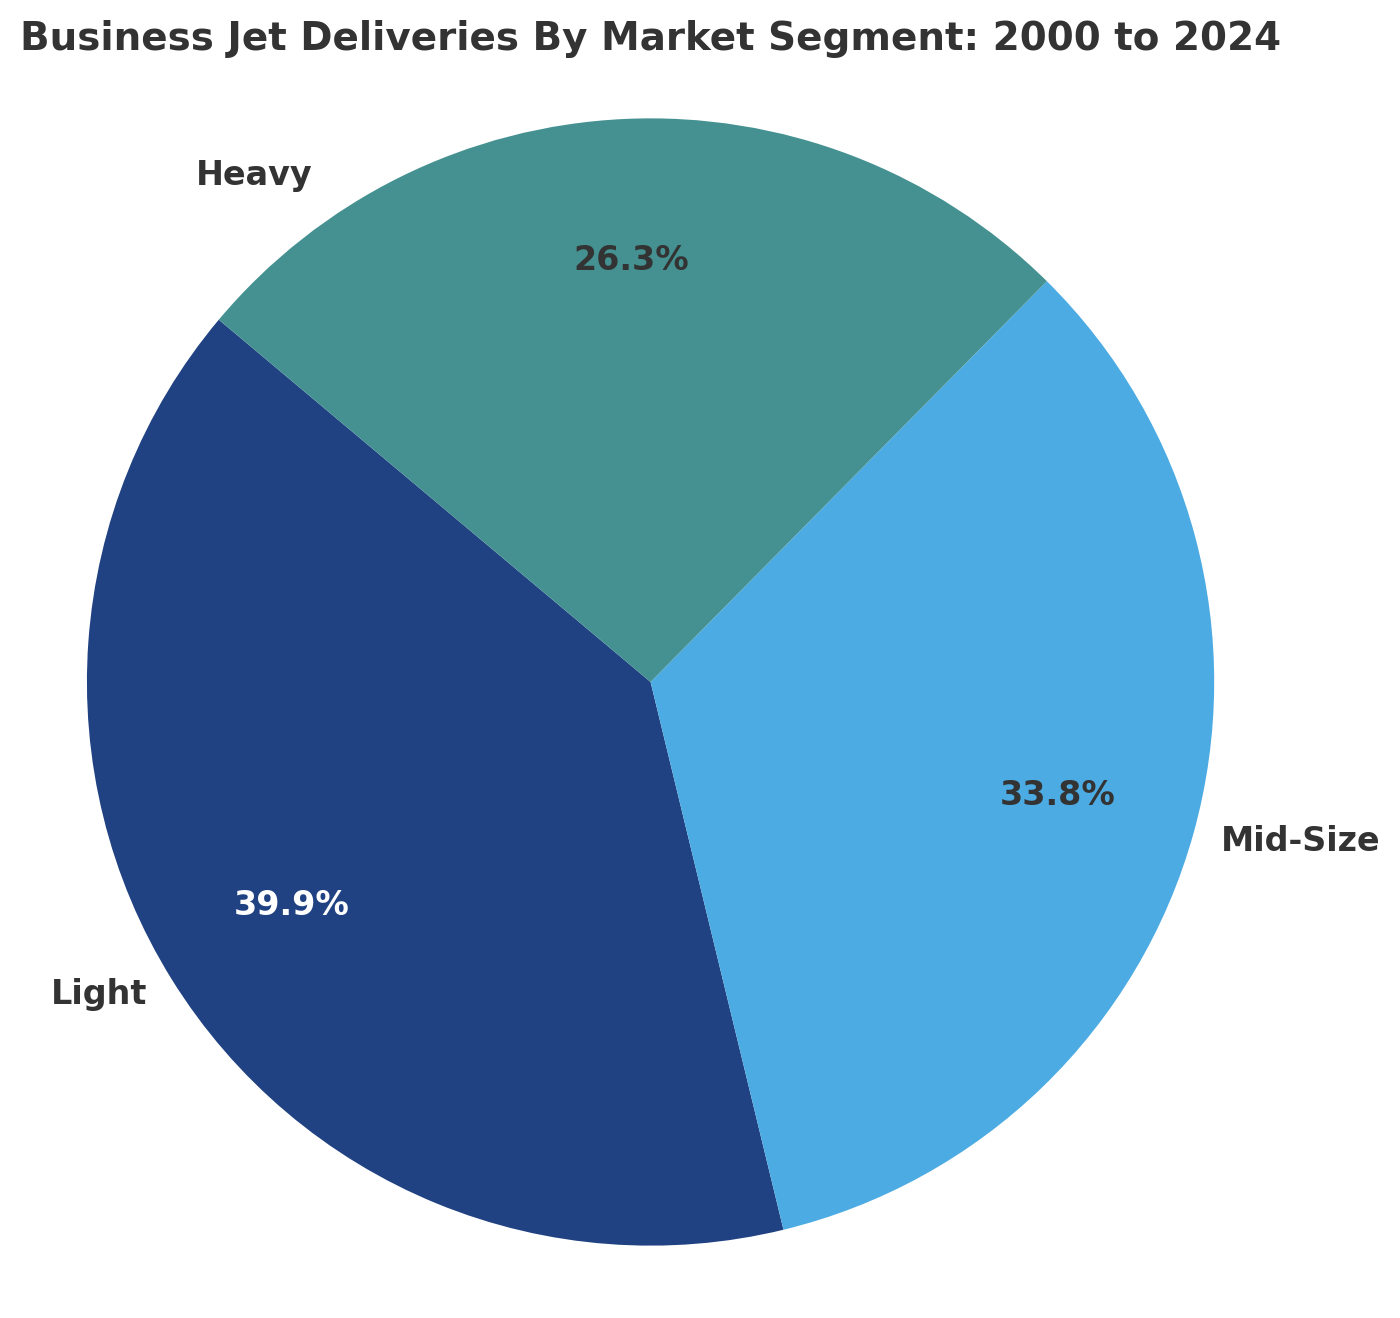
Production declines are expressed in percentage terms, so reviewing each segment’s market share by deliveries provides additional context to the absolute declines in per unit production. From 2000 through 2024:
- Light jets represented 39.9 percent of total production
- Mid-Size jets represented 33.8 percent
- Heavy jets represented 26.3 percent, though this share grew after the great financial crisis, representing 31.1 percent of deliveries from 2012 to 2024.
Additionally, smaller programs inherently exhibit less volatility in unit terms, while larger programs show greater volatility on a per unit basis. For example, a program producing 10 aircraft per year will appear less sensitive on a per unit basis than one producing 50 units, assuming the same percentage decline in production.
Forecast Adjustments Based on Historical Impact
As a result of this historical analysis, our recession-impact assumptions for our business jet forecasts are as follows:
- Light jets: 35 percent production decline
- Mid-Size jets: 45 percent production decline
- Heavy jets: 10 percent production decline
These assumptions are applied as baselines within our forecast modeling. Adjustments are made at the program level based on the competitive landscape and our outlook for the specific program, the size of the aircraft’s backlog, and prior performance. For instance, the Phenom 300 showed countercyclical behavior during the pandemic with production rising from 51 units in 2019 to 56 in 2021 and 59 in 2022. This is partially attributed to the nature of the pandemic, which was shorter in duration and saw increased utilization of business aircraft by private individuals seeking alternatives to commercial air travel. The Phenom 300 is also a staple of the light-jet segment and has been the best-selling and most delivered light business jet for 13 years in a row, so the aircraft holds a propensity towards more stable production. Less mature programs or aircraft in early years of their production cycle may show increased volatility compared to mature programs.
Rationale for Methodological Divergence
We are outlining this methodology because it differs from prevailing practices in most business aviation forecasts. Many forecasts project uninterrupted year-over-year growth. While this simplifies modeling, we consider it to be inconsistent with the volatility observed in historical production data. There have been suggestions to incorporate the projected decline as a smoothed average across the top line of the forecast, but we believe this would distort year specific projections.
We are not asserting that alternative approaches are invalid. Rather, we take a structurally different view. Our methodology attempts to account for cyclical variability and program-level behavior in the business jet market. We recognize that some resistance to this approach may stem from expectation bias and a preference for stable projections. However, historical precedent supports our view that volatility can be explicitly modeled in business jet production forecasting and that production cycles in the segment are rarely linear and stable.

With diverse experience in the commercial aviation industry, Grant joins Forecast International as the Lead Analyst for Commercial Aerospace. He began his career at the Boeing Company, where he worked as a geospatial analyst, designing and building aeronautical navigation charts for Department of Defense flight operations.
Grant then joined a boutique global aviation consulting firm that focused on the aviation finance and leasing industry. In this role he conducted valuations and market analysis of commercial aircraft and engines for banks, private equity firms, lessors and airlines for the purposes of trading, collateralizing and securitizing commercial aviation assets.
Grant has a deep passion for the aviation industry and is also a pilot. He holds his Commercial Pilots License and Instrument Rating in addition to being a FAA Certified Flight Instructor.